We Ran the USDA Numbers on 10 Viral High-Protein TikTok Recipes
Creators print protein counts right in the caption. We independently recomputed 10 viral recipes with USDA math — 9 of 10 landed within 15%, and the only big miss understated protein by 12 grams.
Part of The Protein Atlas — your complete guide to protein.
9 of 10 viral high-protein recipe claims we recomputed landed within 15% of our USDA math, and zero were inflated by more than 15%. Every viral recipe arrives with a number in the caption — a 38 g tiramisu, a 31 g flatbread, a 55 g pizza mac — but few show the arithmetic behind it. So we rebuilt 10 on paper from their published ingredient lists and recomputed every macro claim (the per-serving grams of protein) against USDA data.
The biggest miss we found wasn’t a creator inflating protein. It was a creator shortchanging herself by 12 grams.
We went in expecting inflation. We found the opposite.
- 6 of 10 claims hold up (within 10%), 3 are close (10–15% off), and the one big miss — a cottage cheese wrap — claims 12 g less protein than the recipe actually contains.
- Mean absolute gap: 2.6 g (how far off a typical claim is, regardless of direction). On average, claims run 1.2 g low (which way they lean on net — misses in both directions partly cancel).
- Before trusting a caption, check two things: does it state a serving count, and is a protein-powder scoop carrying the number?
- Want the most verified protein per serving? Make the pizza mac (52.0 g computed) or the chicken tikka masala (49.5 g).
What’s the Scoreboard on All 10 Recipes?
Verdict rule: a claim within 10% of our computed value HOLDS UP, within 10–15% is CLOSE, and more than 15% off gets flagged — INFLATED if the claim is high, UNDERSTATED if it’s low. (kcal is the same unit printed as “Calories” on a nutrition label.)
| # | Recipe | Creator | Claim | Our USDA math | Verdict | Serving basis |
|---|---|---|---|---|---|---|
| 1 | Cottage cheese flatbread | Basics With Bails | 31 g / 245 kcal | 35.9 g | CLOSE (understated) | whole flatbread = 1 serving |
| 2 | Cottage cheese wrap | Good Food Baddie | 25.6 g / 263 kcal | 37.8 g | UNDERSTATED (−32%) | 1 wrap = 1 serving |
| 3 | Cottage cheese ice cream | Feel Good Foodie | 12 g / 169 kcal | 11.9 g | HOLDS UP | 1/4 of batch |
| 4 | Cottage cheese cookie dough | Eating Bird Food | 14 g / 231 kcal | 12.6 g | CLOSE (overstated 11%) | 1/6 of batch |
| 5 | High-protein tiramisu | @smallersam_pcos via SheFinds | 38 g / 310 kcal | 38.5 g | HOLDS UP | single-serve |
| 6 | Dense bean salad | GetHealthyU | 11 g / 235 kcal | 9.7 g | CLOSE (overstated 13%) | 1 cup, batch of 7 |
| 7 | Hot honey cottage cheese beef bowl | Cooking Katie Lady | 30.8 g / 455 kcal | 30.5 g | HOLDS UP | 1/8 of batch |
| 8 | Chicken tikka masala (with rice) | Stealth Health Life | 48 g / 520 kcal | 49.5 g | HOLDS UP | 1/8 of batch |
| 9 | Pizza mac (slow cooker) | Stealth Health Life | 55 g / 610 kcal | 52.0 g | HOLDS UP | 1/10 of batch |
| 10 | Greek yogurt bagels | Fleetstreet, adapted from @EatPayyLove | 12 g per bagel | 11.3 g | HOLDS UP (at 6-bagel yield) | 1 bagel of 6 |
All claims were retrieved from the creator’s page or caption on July 12, 2026, then live-rechecked on August 11. Both dynamic TikTok captions were reverified through TikTok’s own oEmbed response. Provenance matters: 4 of the 10 are recipe-card estimates, 2 are TikTok caption claims, and the rest were written by the creator in prose. And a selection note: these 10 made the list because a full ingredient list and an explicit claim were both retrievable. That makes this 10 checkable claims, not a random sample of TikTok — a finding about these claims, not the platform.
How Did We Check These Claims?
We transcribed the published ingredient quantities, recorded ambiguous measures and brand assumptions, and scored every ingredient against USDA FoodData Central SR Legacy. Where a recipe names a branded product (a protein powder, turkey pepperoni), we used the manufacturer’s label value and flagged it.
Batch recipes are computed on the raw and dry basis printed in the source — raw chicken breast at 22.5 g protein per 100 g (FDC 171077 — the USDA database ID for that entry), dry pasta at 13.04 g, dry rice at 7.13 g — then divided by the creator’s stated serving count. This avoids the common error of applying a water-concentrated cooked-food value to a raw ingredient weight. Cooking mostly changes water concentration; discarded juices can also carry some protein, so this is an ingredient-list estimate rather than a lab assay of the plated meal.
Why 10% and 15% bands rather than decimals? A “cup of cottage cheese” can weigh 210 g or 225 g, and brand swaps move values too — roughly 5–8% of slack on any computed figure, so decimal-point verdicts would be false precision. The core scoreboard is enforced by a validator script that recomputes all 10 servings, verdicts, and headline stats from the raw ingredient data and fails loudly on any drift. One display note: figures are rounded to one decimal, so the printed parts of a sum can differ from the printed total by 0.1 g — the totals use unrounded values.
Which Viral Protein Claims Hold Up?
Six of ten claims landed within 10% of our math — and the most impressive is the most complicated recipe on the list.
The showpiece: Stealth Health Life’s chicken tikka masala. The TikTok caption reads, verbatim: “Per serving (makes 8, includes rice) 520 Calories 48g Protein 55g Carbs 12g Fat” — with a gram-level ingredient list right in the caption. The full chain:
- 1,350 g raw chicken breast × 22.5 g/100 g = 303.8 g
- 310 g 5% Greek yogurt (the 5% is milk fat, not protein) × 9.0 g/100 g = 27.9 g
- 440 g dry rice × 7.13 g/100 g = 31.4 g
- 880 g chicken stock × 2.52 g/100 g = 22.2 g
- cream, tomato paste, tomatoes, onion ≈ 11.1 g
- Total: 396.3 g ÷ 8 servings = 49.5 g per serving vs the claimed 48 g.
The verdict survives every assumption: stock protein varies a lot by product, and even computed with plain water the serving is 46.7 g — the claim stays within 3%. Whoever weighed those ingredients did the math properly.
The other five, briefly. The same creator’s slow-cooker pizza mac claims 55 g across 10 servings; beef, dry pasta, cottage cheese, turkey pepperoni (Hormel’s label), three cheeses, and prosciutto compute to 52.0 g. Feel Good Foodie’s cottage cheese ice cream is nearly exact: a 15 oz container of whole-milk cottage cheese (425 g × 11.12 g/100 g = 47.3 g) plus 1/4 cup honey, split into 4 servings = 11.9 g vs a 12 g claim — and her 169-calorie label matches our calorie math to the digit. Cooking Katie Lady’s hot honey cottage cheese, sweet potato and beef bowl — Google’s #1 viral recipe search of 2025 — claims 30.8 g per eighth of the batch; the live page’s recipe card lists 2 cups of cottage cheese and computes to 30.5 g, while its overview says 1 cup. The one-cup version computes to 27.4 g and moves the verdict from HOLDS UP to CLOSE, but it remains within 15% and does not change the 9-of-10 headline. Avocado and hot honey have no quantities and are excluded. The tiramisu and the bagels also hold up, each with an asterisk covered below.
Which Claims Miss — and in Which Direction?
Three of the four misses are small, and the only large one points the wrong way.
The big one: Good Food Baddie’s cottage cheese wrap, understated by 32%. Her post says “With about 25 grams of protein per wrap”; the recipe-card label reads 25.6 g. But the published ingredients — 8 oz of cottage cheese (227 g × 11.12 g/100 g = 25.2 g) plus 2 eggs (12.6 g) — come to 37.8 g, 12 g more than claimed. Even the egg-white variant she mentions computes to 31.8 g, still 19% above the claim; no listed basis produces 25.6 g. The page calls its nutrition an estimate, and this one appears to be an ingredient-entry or calculator mismatch — in the creator’s own disfavor.
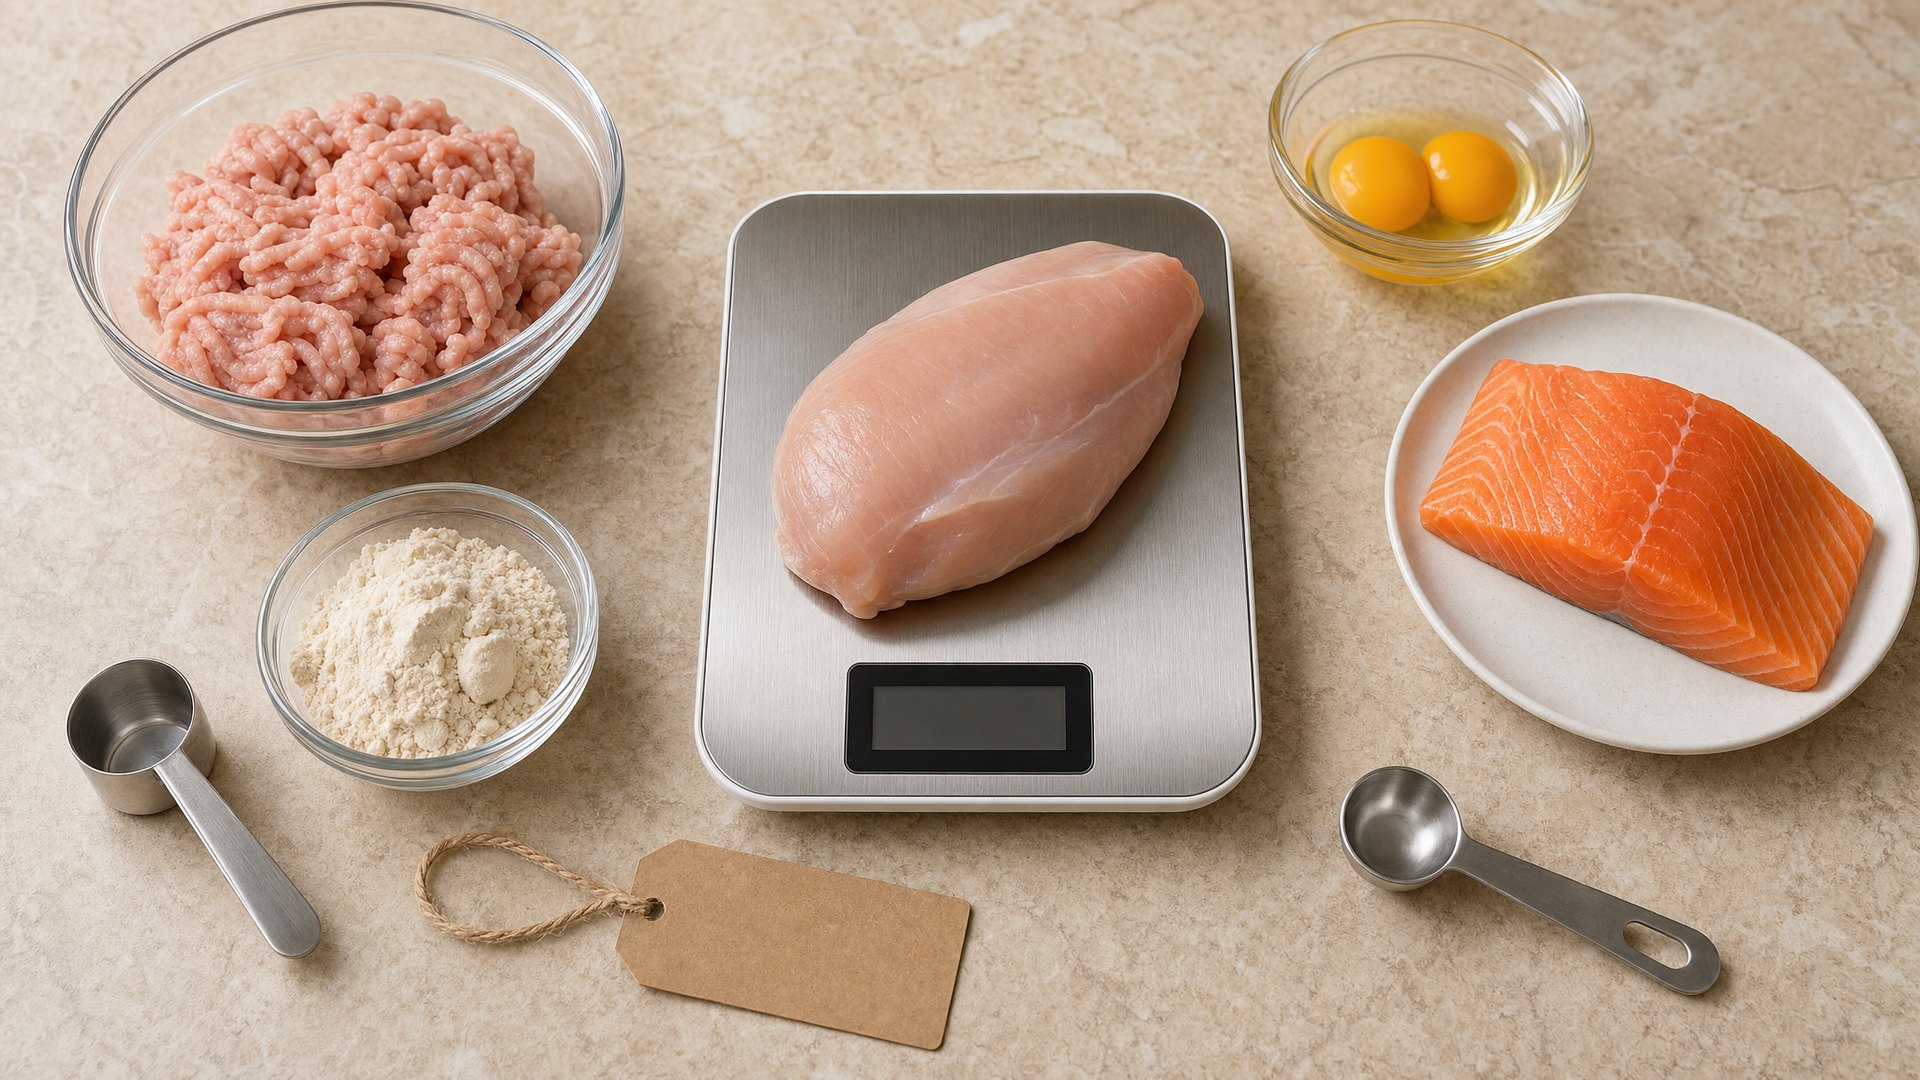
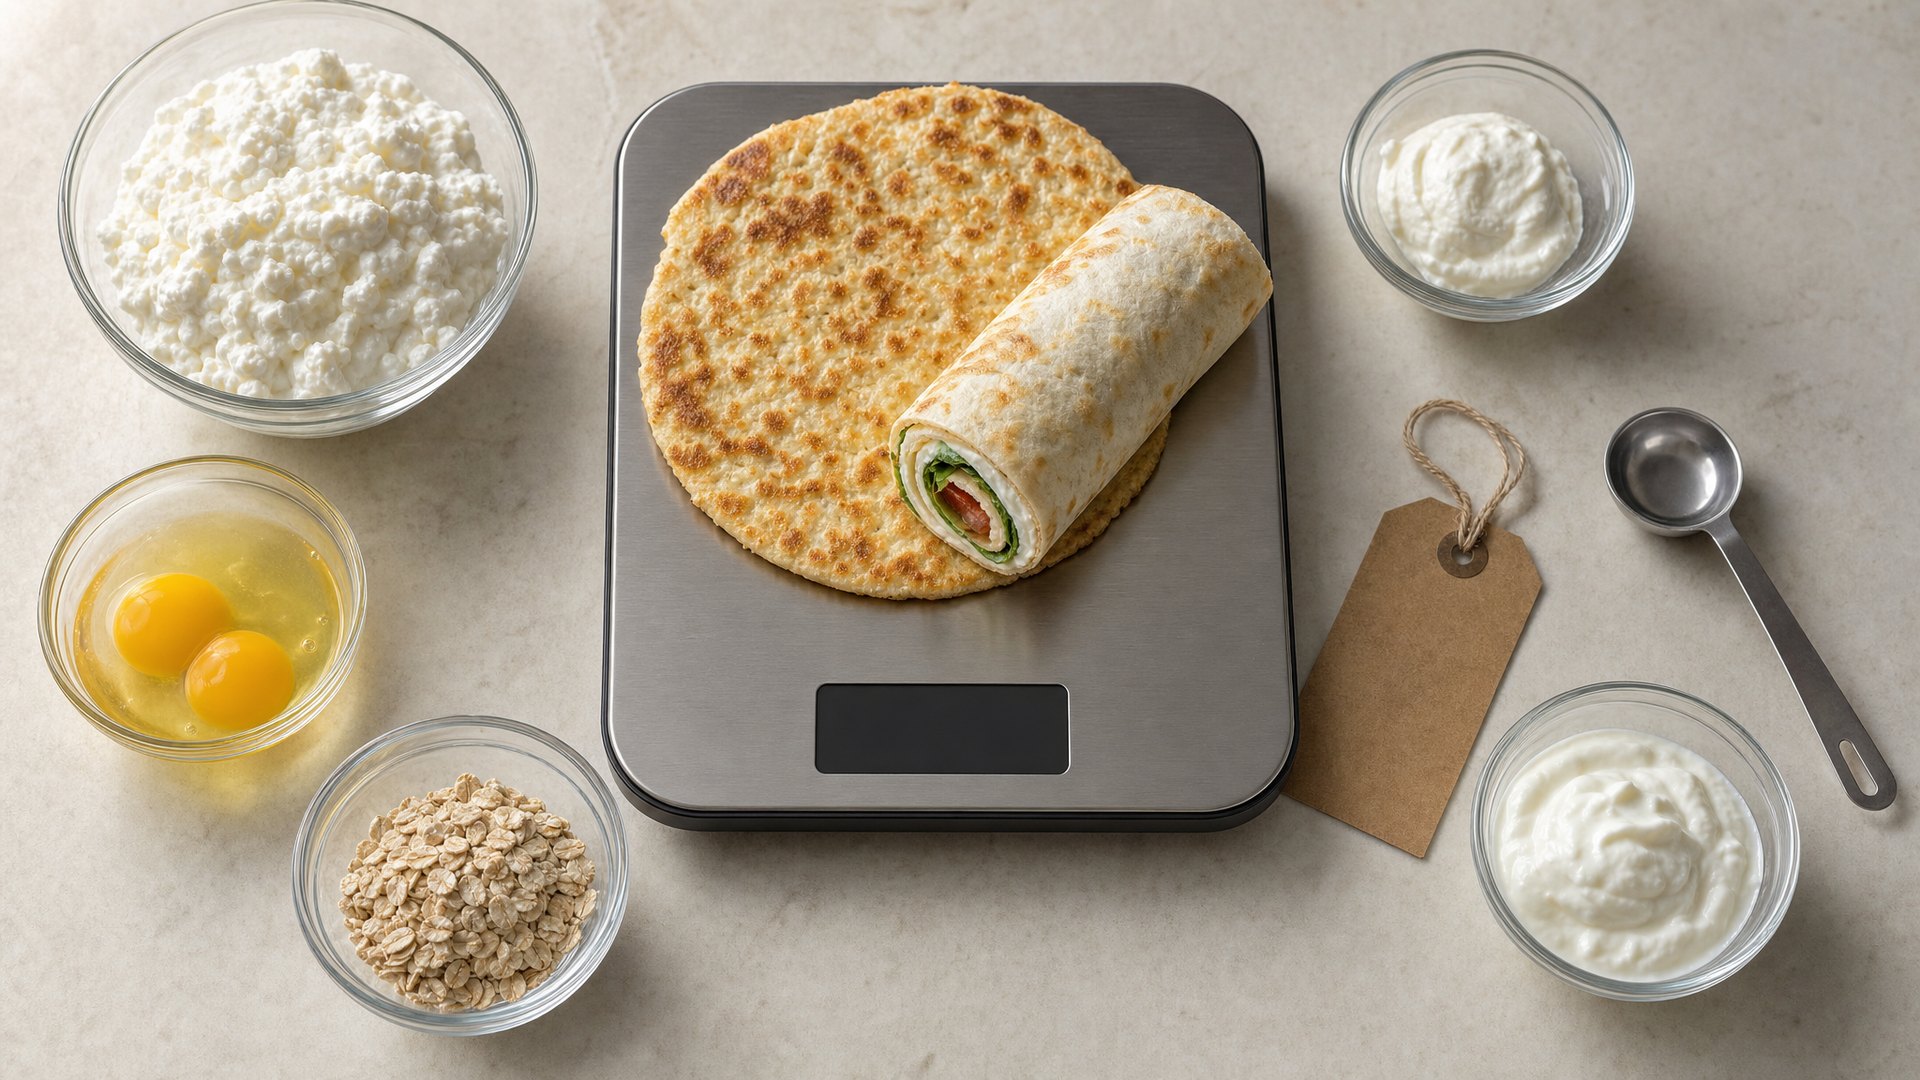
Basics With Bails’ cottage cheese flatbread — the page title is literally “Cottage Cheese Flatbread (31g Protein, No Flour)” — computes to 35.9 g for the whole flatbread: 1 cup of 4% cottage cheese (210 g × 11.12 g/100 g = 23.4 g) plus 2 eggs (12.6 g). Understated again, with one assumption worth stating: at a heavier 225 g cup, the total is 37.6 g and the gap crosses 15%. The USDA values are solid; the cup weight is the soft spot — which is also the fix in your own kitchen: weigh cottage cheese in grams on a kitchen scale instead of scooping by cup, and that drift disappears.
The two modest overstatements: Eating Bird Food’s cottage cheese cookie dough lists 14 g per serving (231 kcal, 6 servings); the cottage cheese, almond flour, pea protein (Nuzest’s label), peanut butter, and chocolate chips total 75.4 g per batch — 12.6 g per serving, so the claim runs 11% high. And GetHealthyU’s dense bean salad — “One serving of this dense bean salad provides 235 calories, 11 grams of protein, and a whopping 10 grams of fiber” — computes to 9.7 g per cup across 7 servings, a claim 13% high. One attribution note: Violet Witchel, who originated the dense-bean-salad format, publishes no macros at all — the 11 g claim belongs to this most-cited version, not to her.
Why Can Creator Labels Drift?
Food-blog recipe cards often generate nutrition estimates with calculator software that must decide which database entry matches a phrase like “1 cup cottage cheese.” Eating Bird Food explicitly labels its nutrition as automatically calculated, while other sources call theirs estimates. In our searching, published protein figures for near-identical cottage cheese cookie dough varied by a wide margin from blog to blog — same dough, same serving, very different labels.
Add conservative rounding and labels computed on a base recipe while the pictured version includes extras, and you get the pattern in our data: a mean signed gap of −1.2 g — the directional counterpart of that 2.6 g typical miss, where over- and understatements partly cancel. On net the average claim runs slightly low, though that average is carried almost entirely by one recipe — the wrap and its unexplained estimate.
Treat a creator’s nutrition label as an estimate until the serving count and ingredient basis are clear. In this sample, the errors mostly point down, not up.
What’s the Serving-Size Catch?
We expected serving-size games to be the inflation trick of choice. What we found is sloppier and more forgivable: ambiguity.
The cleanest example is the Greek yogurt bagel recipe claiming 12 g per bagel. The dough — gluten-free flour, 1.5 cups of Greek yogurt, cheddar, egg wash — computes to 67.9 g of protein, and the instructions say to divide it into “4 to 6 portions.” At 6 bagels that’s 11.3 g each and the claim holds; at 4 bagels it’s 17.0 g each and the claim understates by 29%. Both numbers are true; the recipe just never picks one. (A side note from that math: rice-based gluten-free flour has about half the protein of wheat flour — 5.41 vs 10.33 g/100 g — so the yogurt and cheddar are carrying that bagel.)
The other ambiguities to watch: whether toppings are included, and what the batch divisor is (a “serving” of pizza mac is a tenth of a slow cooker). Whenever the pieces are stated, the math checks out; it’s when the serving is left vague that a printed number stops meaning anything.
Do Branded Protein Powders Change the Math?
They change whose math you’re trusting. The high-protein tiramisu claims “(310 cals + 38g protein)” and our total lands at 38.5 g — but 20 g of that, 52% of the recipe’s protein, is a single scoop of Clean Simple Eats vanilla powder taken on the brand’s label value. The Greek yogurt (17.3 g), wafers, and cocoa we can verify against USDA entries; the scoop we cannot. So this HOLDS UP verdict is conditional: the creator’s arithmetic is right if the tub’s label is right.
Powder-based viral recipes are label-trust exercises: if the claim is mostly one scoop, your real question is about the powder, not the recipe (our Canadian powder ranking compares tubs per gram of actual protein). The cookie dough has the same structure in miniature: a quarter-cup of pea protein contributes 21.6 g of its batch, straight from Nuzest’s label.
Which Viral Recipes Are Actually Protein-Dense?
A recipe can deliver its claimed protein and still be mostly dessert. To separate protein-dense from protein-flavored, divide claimed protein × 4 kcal (protein’s calorie value per gram) by claimed calories — the share of each serving’s calories that come from protein. This is arithmetic on the creators’ own claimed numbers, not a new measurement. The anchor for scale: plain chicken breast is 75% (31 g × 4 ÷ 165 kcal).
| Recipe | Protein share of claimed calories |
|---|---|
| Cottage cheese flatbread | 51% |
| High-protein tiramisu | 49% |
| Cottage cheese wrap | 39% |
| Chicken tikka masala | 37% |
| Pizza mac | 36% |
| Cottage cheese ice cream | 28% |
| Hot honey beef bowl | 27% |
| Cottage cheese cookie dough | 24% |
| Dense bean salad | 19% |
(The bagels publish no calorie claim, so they’re excluded.)
The flatbread and tiramisu are genuinely protein-dense — about half their calories are protein, remarkable for things pretending to be bread and dessert. The bean salad at 19% is the other end: a fine dish whose claim stays in our CLOSE band, but it’s a fiber dish (10 g per serving, per its own label) wearing a protein costume. If protein-per-calorie is your filter, our protein-per-calorie ranking applies this lens to every recipe we publish.
What Should You Make Instead?
You don’t have to make anything instead — most of these claims check out. But if a viral recipe got you curious, here’s the closest match from our kitchen, with macros computed from USDA data:
- Loved the flatbread or wrap idea? Cottage Cheese Protein Pancakes run 26.8 g per serving.
- The ice cream’s cousin, no churning: Cottage Cheese Berry Night Bowl (25.1 g, 249 kcal).
- For the cookie-dough craving, our Chocolate Peanut Butter Yogurt Mousse hits 42.2 g — more than triple the dough’s computed 12.6 g.
- Tiramisu energy without the powder dependency: Chia Greek Yogurt Protein Pudding, 40.4 g.
- Our direct answer to Google’s #1 viral recipe of 2025: Hot Honey Ground Turkey Bowls, 52.0 g per serving.
- And a bean bowl that is a protein anchor: Chipotle Black Bean Quinoa Bowls, 30.2 g.
A Canadian note, since most high-protein recipes going viral are written for US pantries: US recipes commonly call for 15 oz (425 g) cans of beans, while Canadian shelves commonly carry 540 mL cans. Those labels use different units, and drained yield varies by product, so do not scale the protein by 540 ÷ 425 — drain and weigh the beans. At an August 11 spot-check, Walmart.ca listed Nordica 2% cottage cheese, 500 g at $5.24 and Great Value chickpeas, 540 mL at $1.44; retail prices vary by location. Eggs averaged $4.85 a dozen nationally in Statistics Canada’s May 2026 table.
How Should You Read the Next Viral Macro Claim?
The four-question check, based on where these 10 actually bent:
- Is there a stated serving count? “Makes 8” with gram weights is checkable; “4 to 6 portions” under a per-bagel claim leaves the real number anywhere from 11.3 g to 17.0 g.
- Is a powder scoop carrying the claim? If most of the protein is one branded scoop, you’re trusting a tub label, not a recipe.
- Is the label a recipe-card estimate? Don’t read too much into direction: three of the four recipe-card estimates in our sample ran flat or slightly high, and the low average came almost entirely from one of them (the wrap). What an estimated label tells you is to verify its ingredient and serving assumptions.
- Are toppings in or out? Batch bowls often label the base only.
A claim that passes all four — like that tikka masala caption — deserves your trust. And the two cottage-cheese-and-egg recipes we checked (the wrap and the flatbread) both contain more protein than advertised.
The Bottom Line
Of 10 viral protein claims we recomputed with USDA math, 9 were within 15% and none were inflated beyond it — the claims averaged 1.2 g low. This week: if you want the most verified protein per serving, make the pizza mac (52.0 g computed) or the tikka masala (49.5 g) — both linked TikTok captions publish gram-level ingredients and serving counts — or skip the app and make our fully written Hot Honey Ground Turkey Bowls (52.0 g). If you want dessert that earns its label, the tiramisu’s 38 g claim is real, powder scoop permitting.
Frequently Asked Questions
Do viral TikTok protein recipes actually deliver the protein they claim?
Mostly yes, for the 10 claims we could fully check: 9 of 10 landed within 15% of our USDA recomputation, none were inflated by more than 15%, and the average gap was 2.6 g. On average the claims ran 1.2 g low — the biggest miss was a creator understating her own wrap by about 12 g.
How much protein is actually in cottage cheese flatbread?
About 36 g for the whole flatbread made from 1 cup of cottage cheese and 2 eggs — more than the viral 31 g claim. The exact figure depends on how much cottage cheese fits in your cup (we used 210 g); either way, the claim understates it.
How much protein is in cottage cheese ice cream?
About 12 g per serving for the blended base of one 15 oz container of whole-milk cottage cheese and 1/4 cup honey, split into 4 servings. We computed 11.9 g against the 12 g claim, and the 169-calorie label matches our math too.
Is dense bean salad actually high in protein?
Moderately. We computed about 10 g of protein per 1-cup serving against a claimed 11 g. Its own label’s 10 g of fiber is the more impressive number — treat dense bean salad as a fiber dish, not a protein anchor.
Which viral TikTok recipe has the most protein per serving?
Of the 10 we checked, Stealth Health Life’s slow-cooker pizza mac: 52.0 g computed per serving against a 55 g claim. The same creator’s chicken tikka masala is close behind at 49.5 g computed against a 48 g claim.
What’s the most protein-dense viral recipe per calorie?
The cottage cheese flatbread: about 51% of its claimed calories come from protein, with the high-protein tiramisu just behind at 49%. For scale, plain chicken breast is 75%. These shares are arithmetic on the creators’ claimed numbers, not a new measurement.
- The Cheapest Protein Per Gram: 52 Foods Ranked — the same shown-math treatment applied to your grocery bill.
- The Cheapest Protein Powder in Canada — if a scoop is carrying your recipe, make it a well-priced one.
- We Ranked All 112 Recipes by Protein-Per-Calorie — the protein-density lens applied to our own recipes.
Featured Recipes
All 6 recipes from this article, ready to cook
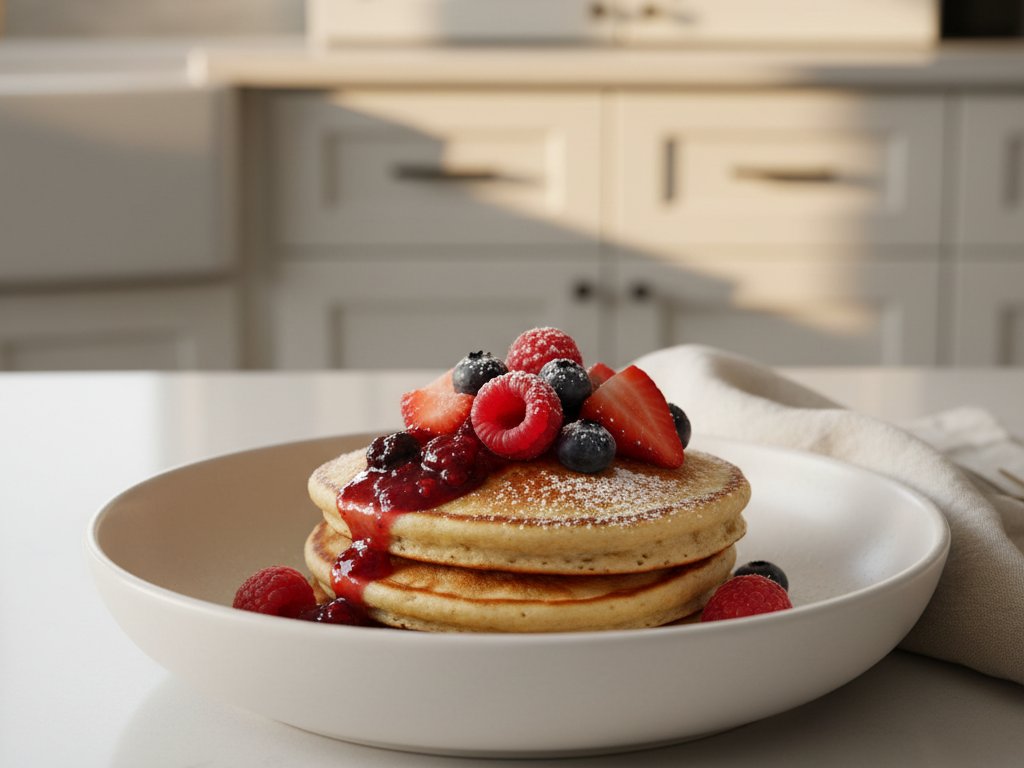
1. Fluffy Cottage Cheese Pancakes with Berry Compote
Pillowy blended cottage cheese pancakes topped with warm berry compote. 27g protein, 403 cal, 50 min. Weekend brunch elevated.
View Recipe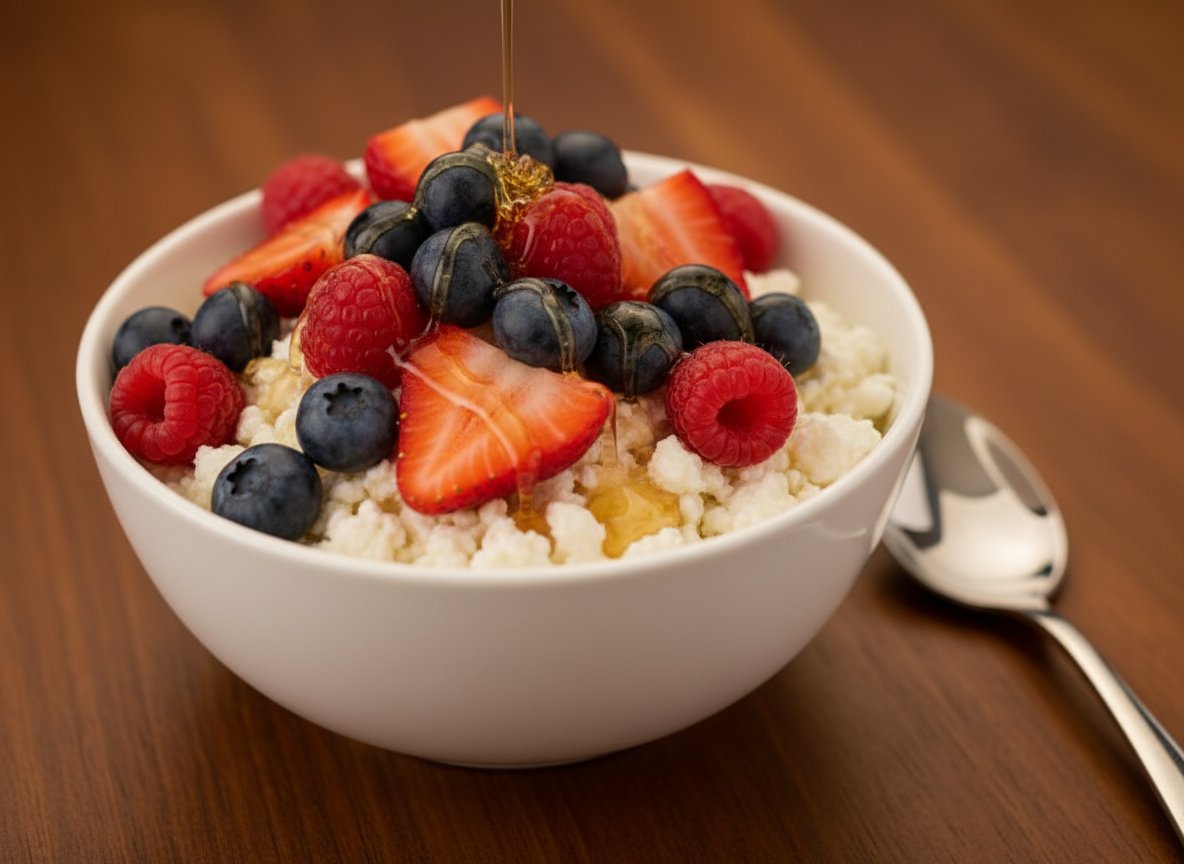
2. Cottage Cheese Berry Night Bowl with 25g Protein
5-minute pre-bed cottage cheese snack with mixed berries and honey. 25g protein, 249 calories. Low-fat cottage cheese for overnight satiety.
View Recipe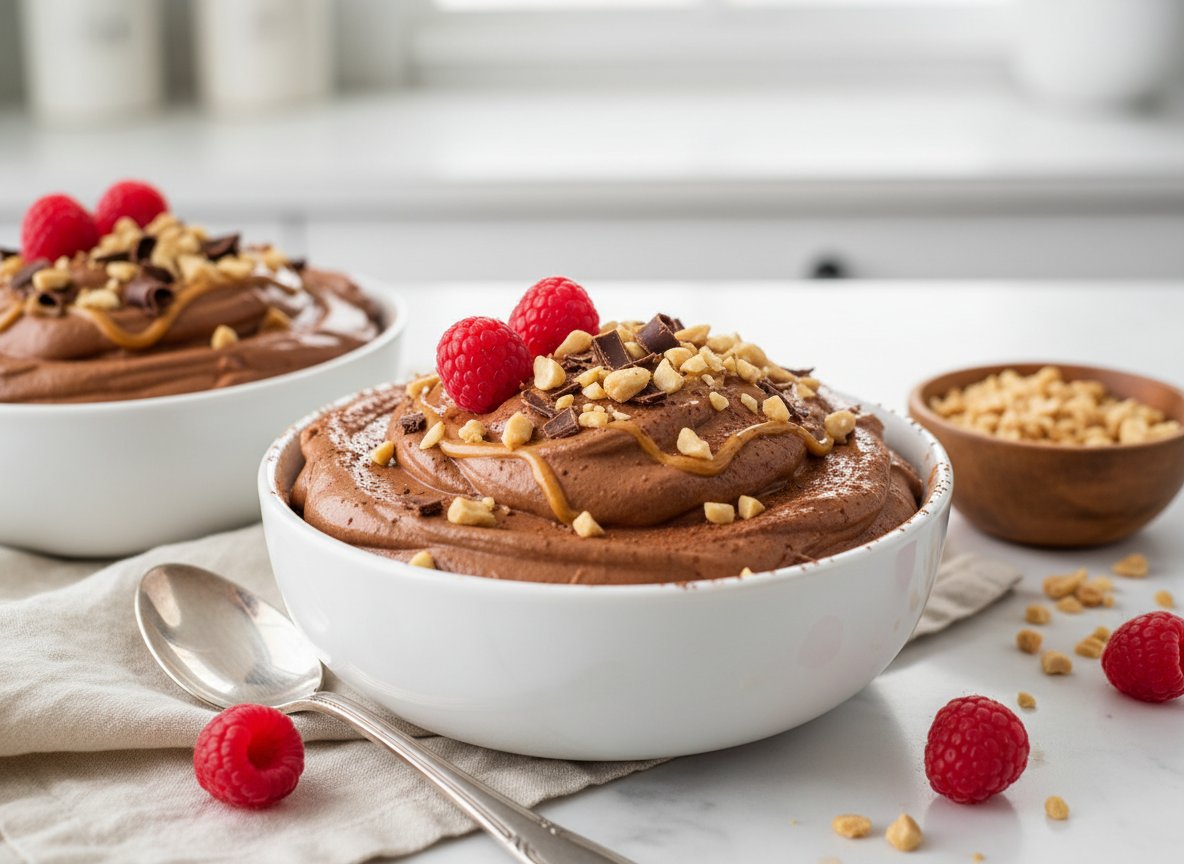
3. Chocolate Peanut Butter Yogurt Mousse
Velvety chocolate meets creamy peanut butter in this guilt-free Greek yogurt treat. 42g protein, 380 cal, 40 min. Decadent without the damage.
View Recipe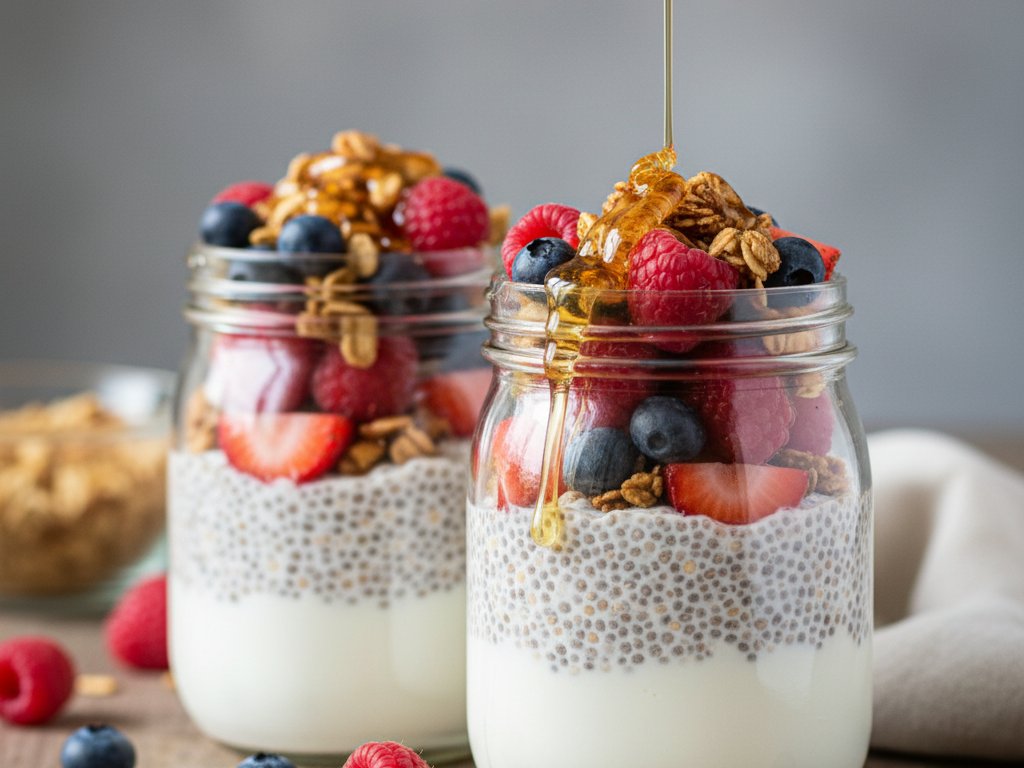
4. Chia & Greek Yogurt Breakfast Pudding
Thick, creamy Greek yogurt swirled with chia seeds, ready when you are. 40g protein, 394 cal, 10 min prep. Zero cooking, maximum morning satisfaction.
View Recipe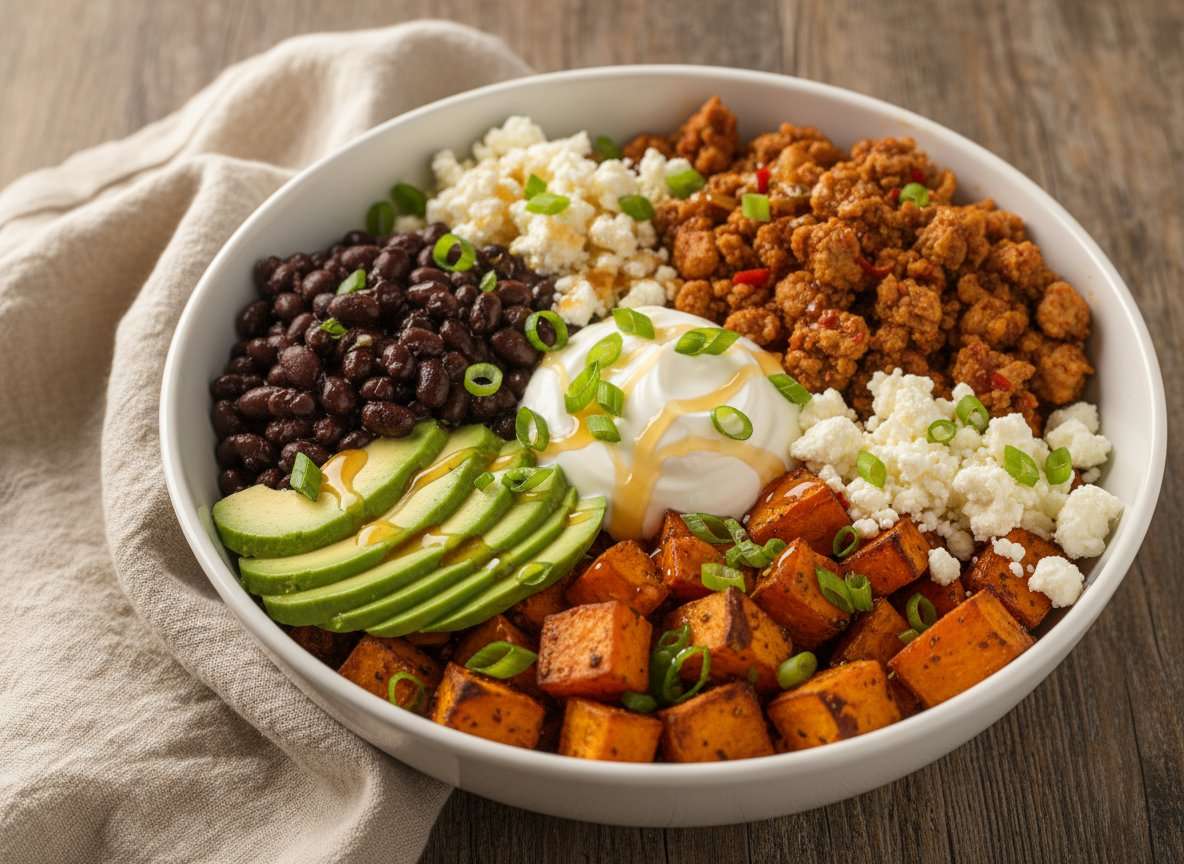
5. Hot Honey Ground Turkey Bowls with 52g Protein
Hot Honey Ground Turkey Bowls: 52g protein, 655 cal. Taco-seasoned turkey, roasted sweet potato, black beans, Greek yogurt, feta, hot honey. 32 min.
View Recipe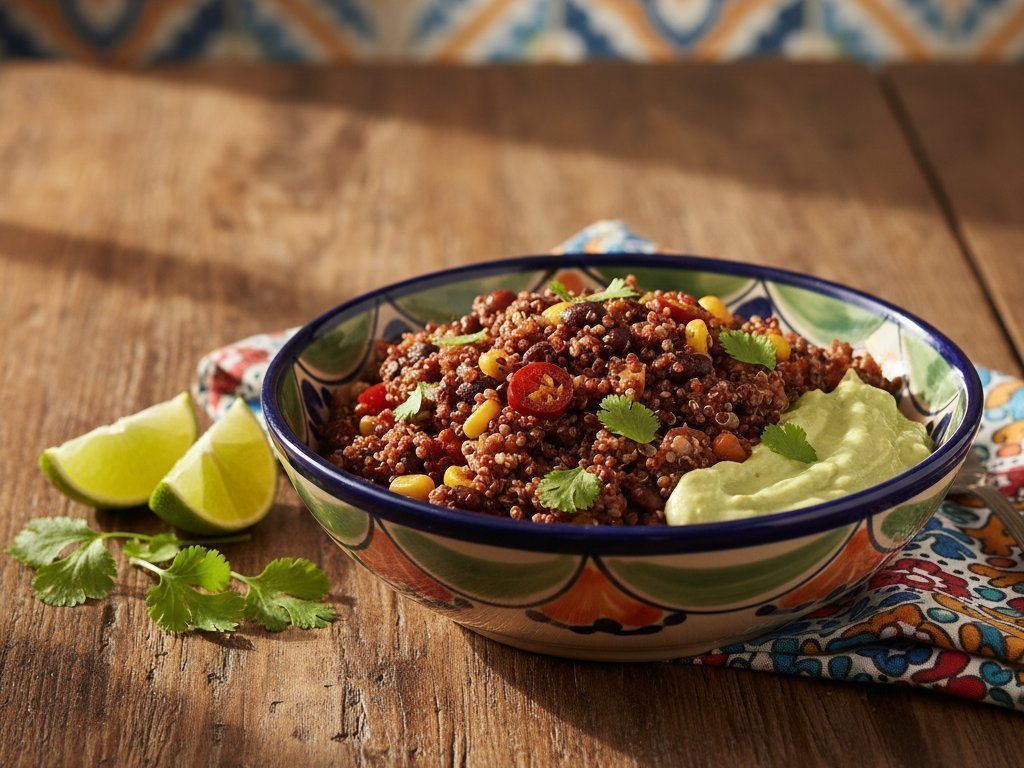
6. Chipotle Black Bean Quinoa Bowls with Avocado Crema
Slow-simmered black beans over fluffy quinoa with silky avocado crema. 30g protein, 604 cal, 55 min. Plant-powered and satisfying.
View Recipe